Division of the EU’s European Commission Used Material Developed by Scott M. Graffius

Strategic objectives play a crucial role in guiding organizations towards achieving their vision and mission. They’re fulfilled by projects, endeavors undertaken to create a unique product, service, or result.
The art and science of project management (Agile or otherwise) — the application of knowledge, skills, tools, and techniques to projects — is indispensable for the management and completion of projects. And tools can make a significant contribution to successful outcomes.
In 2007, Scott M. Graffius developed a fresh take on RACI charts, a simple project management tool. His unique material provides audiences with practical information they can use to leverage RACI charts to help manage complexities and achieve success. Graffius periodically refreshes his work. In 2020, he published an updated version on ResearchGate, a European platform for researchers and scientists.
Graffius' respective work is here and citation information follows:
Graffius, Scott M. (2020). How the RACI Tool Can Help You: Use RACI to Establish Roles and Responsibilities—and Improve Outcomes—for Projects and Other Work. Los Angeles, California: Exceptional PPM and PMO Solutions. DOI: 10.13140/RG.2.2.14713.62561/4.
A division of the EU’s European Commission, Erasmus+, used Graffius' material in one of their publications. Their work is here and select visuals follow.
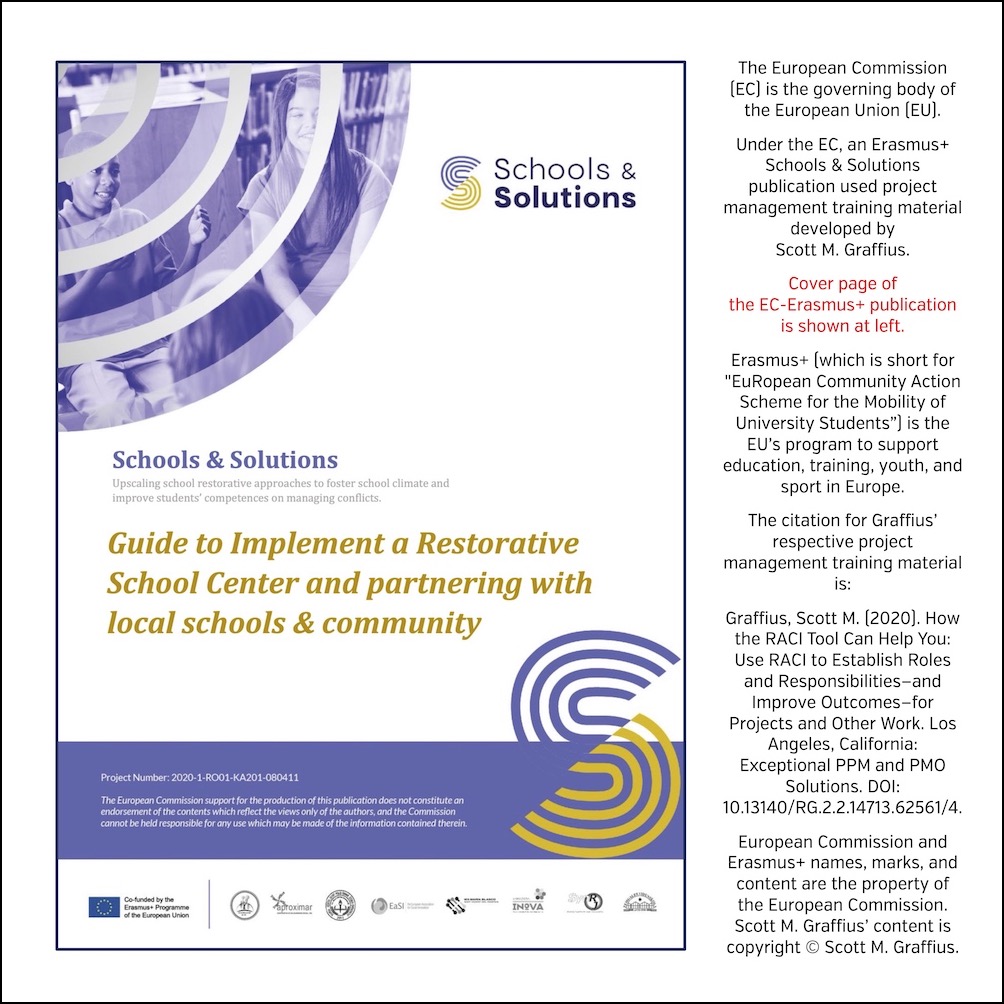
The cover page is shown above.
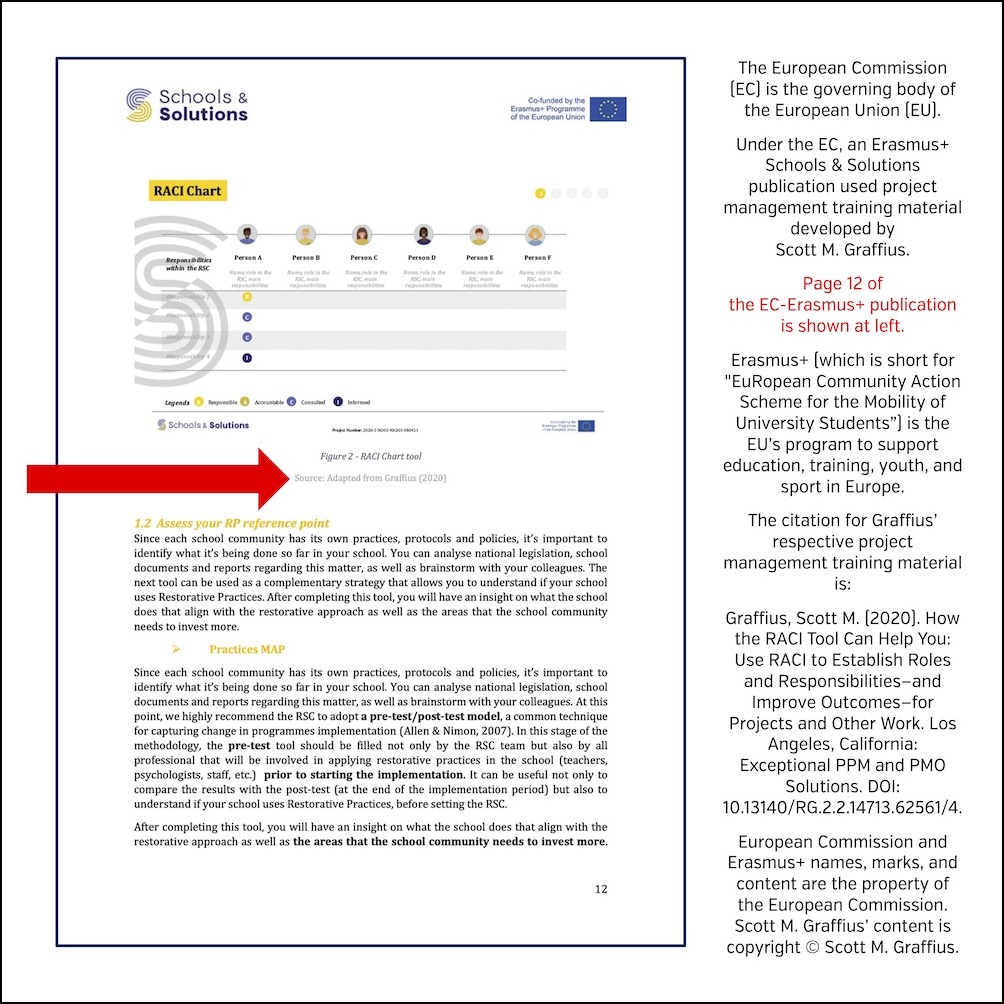
Page 13 is shown above.
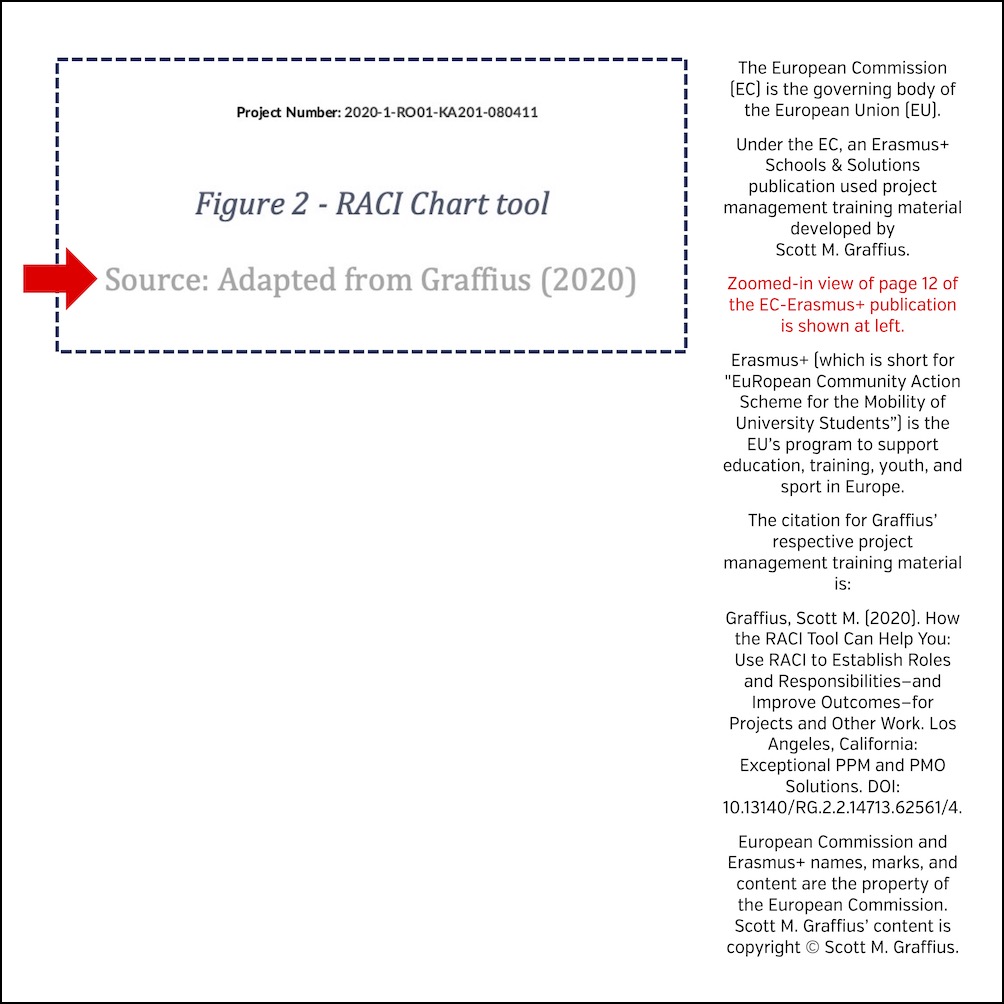
A zoomed-in version visual of page 13 is shown above.
About the European Commission
The European Commission (EC) is the governing body of the European Union (EU). It represents and upholds the interests of the EU as a whole and it is independent of national governments. The EC prepares legislation for adoption by the Council (representing the member countries) and the Parliament (representing the citizens). It administers the budget and the policy programs in cooperation with authorities in the member countries. The EC has an administrative body of about 32,000 European civil servants. Visit https://commission.europa.eu to learn more.
About Erasmus+
Erasmus+ (which is short for "EuRopean Community Action Scheme for the Mobility of University Students") is the European Union’s program to support education, training, youth, and sport in Europe. To learn more, visit https://erasmus-plus.ec.europa.eu.
About ResearchGate
Started in 2008, ResearchGate is a platform for researchers and scientists to connect, collaborate, and share their work. It reports, "Our mission is to connect the world of science and make research open to all." Visit https://www.researchgate.net to learn more.
How to Cite This Article
Graffius, Scott M. (2024, April 1). Division of the EU’s European Commission Used Material Developed by Scott M. Graffius. Available at: https://scottgraffius.com/blog/files/eu-2024.html. DOI: 10.13140/RG.2.2.23115.40488.


About Scott M. Graffius

Scott M. Graffius, PMP, SA, CSP-SM, CSP-PO, CSM, CSPO, ITIL, LSSGB is an agile project management practitioner, consultant, thinker, creator, multi-award-winning author, and international public speaker. Founder and CEO of Exceptional PPM and PMO Solutions™ and subsidiary Exceptional Agility™, he has generated over $1.9 billion for Global Fortune 500 businesses and other organizations he has served. Graffius and content from his books, talks, workshops, and more have been featured and used by Microsoft, Oracle, Broadcom, Cisco, Gartner, Project Management Institute, IEEE, National Academy of Sciences, United States Department of Energy, Yale University, Tufts University, and others. He delights audiences with dynamic and engaging talks and workshops on agile project management, AI, Tech leadership, video game development, strategic alignment, the science of high performance teams, and more. To date, he's presented sessions at 89 conferences and other events across 25 countries.
His full bio is available here.
Connect with Scott on:


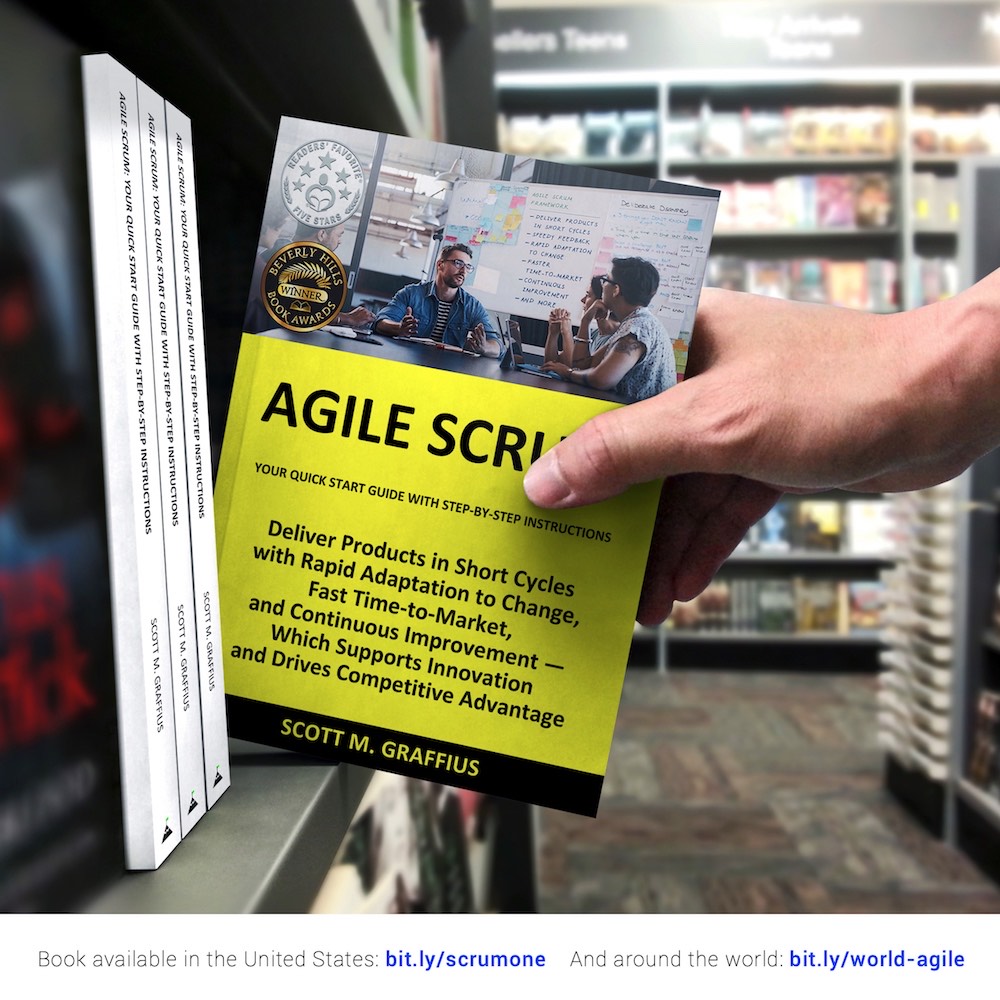
About Agile Scrum: Your Quick Start Guide with Step-by-Step Instructions
Shifting customer needs are common in today's marketplace. Businesses must be adaptive and responsive to change while delivering an exceptional customer experience to be competitive.
There are a variety of frameworks supporting the development of products and services, and most approaches fall into one of two broad categories: traditional or agile. Traditional practices such as waterfall engage sequential development, while agile involves iterative and incremental deliverables. Organizations are increasingly embracing agile to manage projects, and best meet their business needs of rapid response to change, fast delivery speed, and more.
With clear and easy to follow step-by-step instructions, Scott M. Graffius's award-winning Agile Scrum: Your Quick Start Guide with Step-by-Step Instructions helps the reader:
- Implement and use the most popular agile framework―Scrum;
- Deliver products in short cycles with rapid adaptation to change, fast time-to-market, and continuous improvement; and
- Support innovation and drive competitive advantage.
Hailed by Literary Titan as “the book highlights the versatility of Scrum beautifully.”
Winner of 17 first place awards.
Agile Scrum: Your Quick Start Guide with Step-by-Step Instructions is available in paperback and ebook/Kindle in the United States and around the world. Some links by country follow.
- 🇧🇷 Brazil
- 🇨🇦 Canada
- 🇨🇿 Czech Republic
- 🇩🇰 Denmark
- 🇫🇮 Finland
- 🇫🇷 France
- 🇩🇪 Germany
- 🇬🇷 Greece
- 🇭🇺 Hungary
- 🇮🇳 India
- 🇮🇪 Ireland
- 🇮🇱 Israel
- 🇮🇹 Italy
- 🇯🇵 Japan
- 🇱🇺 Luxembourg
- 🇲🇽 Mexico
- 🇳🇱 Netherlands
- 🇳🇿 New Zealand
- 🇳🇴 Norway
- 🇪🇸 Spain
- 🇸🇪 Sweden
- 🇨🇭 Switzerland
- 🇦🇪 UAE
- 🇬🇧 United Kingdom
- 🇺🇸 United States

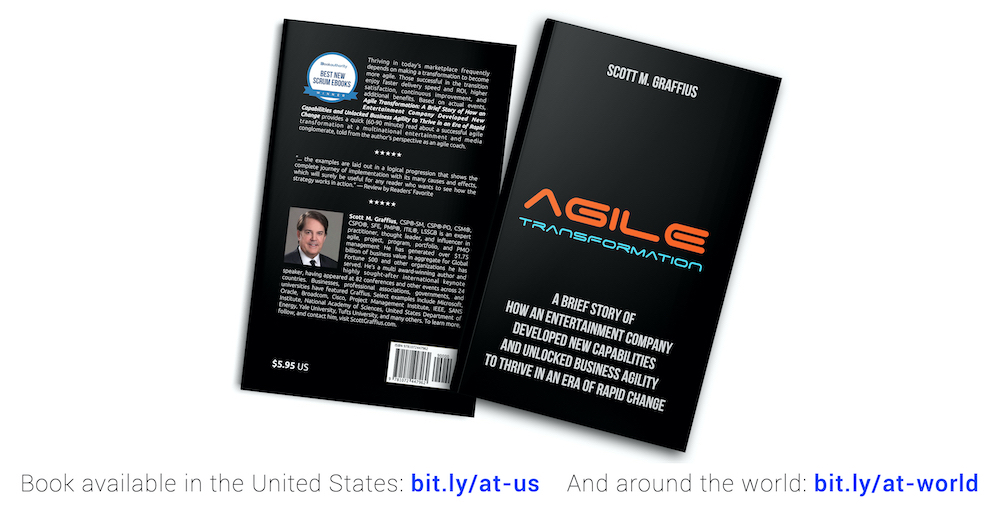
About Agile Transformation: A Brief Story of How an Entertainment Company Developed New Capabilities and Unlocked Business Agility to Thrive in an Era of Rapid Change
Thriving in today's marketplace frequently depends on making a transformation to become more agile. Those successful in the transition enjoy faster delivery speed and ROI, higher satisfaction, continuous improvement, and additional benefits.
Based on actual events, Agile Transformation: A Brief Story of How an Entertainment Company Developed New Capabilities and Unlocked Business Agility to Thrive in an Era of Rapid Change provides a quick (60-90 minute) read about a successful agile transformation at a multinational entertainment and media company, told from the author's perspective as an agile coach.
The award-winning book by Scott M. Graffius is available in paperback and ebook/Kindle in the United States and around the world. Some links by country follow.
- 🇦🇺 Australia
- 🇦🇹 Austria
- 🇧🇷 Brazil
- 🇨🇦 Canada
- 🇨🇿 Czech Republic
- 🇩🇰 Denmark
- 🇫🇮 Finland
- 🇫🇷 France
- 🇩🇪 Germany
- 🇬🇷 Greece
- 🇮🇳 India
- 🇮🇪 Ireland
- 🇯🇵 Japan
- 🇱🇺 Luxembourg
- 🇲🇽 Mexico
- 🇳🇱 Netherlands
- 🇳🇿 New Zealand
- 🇪🇸 Spain
- 🇸🇪 Sweden
- 🇨🇭 Switzerland
- 🇦🇪 United Arab Emirates
- 🇬🇧 United Kingdom
- 🇺🇸 United States

The short link for this article is: https://bit.ly/eu-2024
© Copyright 2024 Scott M. Graffius. All rights reserved. This material may not be published, broadcast, rewritten or redistributed without the express written permission of Scott M. Graffius.

What Are Your Chances of Project Success? [From the Archives - First Published in 2003]


This article was first published on 12 July 2003.

The Standish Group provides research reports valued by those in technology management. In their Chaos Report and the follow-up Compass Report, Standish reported the top 10 criteria for project success.
This unique self-assessment is based on Scott M. Graffius' professional experience and Standish's findings. You're invited to take it to identify your project's success potential.
Note: This tool is tailored for projects utilizing a waterfall or hybrid approach and is not applicable to agile projects.
User Involvement
- Are the right users involved?
- Additionally, are the right users involved early and often?
- Are there good relationships with the users?
- Is involvement easy (frictionless)?
- Are the users’ needs uncovered?
___ total items with a “Yes” x 3.8 = ___.
Executive Management Support
- Is the right key executive(s) involved?
- Does the key executive(s) have a stake in the outcome?
- Does the project team have a stake as well?
- Is there a well-defined project plan?
- Is it understood that failure is a possibility?
___ total items with a “Yes” x 3.2 = ___.
Clear Statement of Requirements
- Is there a concise vision?
- Is there a business case?
- Is there a functional analysis?
- Is there a risk assessment?
- Have metrics been identified for tracking and reporting?
___ total items with a “Yes” x 3.0 = ___.
Proper Planning
- Is there a problem/pain/opportunity statement?
- Is there a solution statement?
- Have the right team members been assigned to the project?
- Is there a firm specification/requirements?
- Are there attainable milestones?
___ total items with a “Yes” x 2.2 = ___.
Realistic Expectations
- Are the specifications/requirements clear?
- Prioritization of needs? (While the default plan is to fulfill all requirements, the importance/value of each one should be quantified or qualified so that the most important items are prioritized.)
- Are there small/manageable milestones?
- Is change manageable (through a change management process or otherwise)?
- Can the project be prototyped or delivered in phases or incrementally?
___ total items with a “Yes” x 2.0 = ___.
Small Milestones
- Is the 80/20 rule observed (focus on the 20% of features that result in 80% of the benefit)?
- Is top-down design used?
- Are time limits set?
- Is a prototype tool used?
- Can progress be objectively measured?
___ total items with a “Yes” x 1.8 = ___.
Competent Staff
- Has a gap analysis on skills been done (and needed skills identified, if applicable)?
- Are the right people on the team?
- Is there a training program or otherwise an opportunity for team members to level up their skills?
- Are there appropriate incentives?
- Is the team appropriately skilled/equipped/available to see the project to completion?
___ total items with a “Yes” x 1.6 = ___.
Project Ownership
- Are roles for team members defined?
- Are roles for those involved with the project but not a member of the team (such as sponsors or executives) also defined?
- Does everyone have a good understanding of they will collaborate and contribute on the project?
- Are incentives tied to success?
- Is everyone involved committed?
___ total items with a “Yes” x 1.2 = ___.
Clear Vision and Objectives
- Is the vision shared?
- Is the vision aligned with the organization’s goals?
- Are objectives achievable?
- Are objectives measurable?
- Are sanity checks/gates in place?
___ total items with a “Yes” x 0.6 = ___.
Focused Staff
- Are there incentives?
- Is there a focus on the deliverables?
- Does each team member have part ownership?
- Is everyone working together?
- Is confidence being built as the team progresses?
___ total items with a “Yes” x 0.6 = ___.
Add all of the points to obtain the final score. Total score is ____ out of a maximum of 100 points.
Results range from 100 to 0, with 100 being the ideal for the project's success potential.
It is suggested that projects with a score less than 90 are revisited, and that challenges or impediments are resolved.

How to Cite This Article
Graffius, Scott M. (2016, January 2). What Are Your Chances of Project Success? [From the Archives - First Published on 12 December 2012]. Available at: https://scottgraffius.com/blog/files/archive---chances-of-project-success.html.

© Copyright 2016 Scott M. Graffius. All rights reserved. This material may not be published, broadcast, rewritten or redistributed without the express written permission of Scott M. Graffius.

Typical Software Development Risks: Symptoms, Causes, Indicators, and Mitigations [From the Archives - First Published in 2012]


This article was first published on 16 December 2012.

The risks for software development projects can vary. However, this article provides a view of the typical risks along with the respective symptoms, root causes, leading indicators, and mitigations for each.
Risk: Inaccurate effort and estimates and schedules
- Symptoms to watch for: Pattern of late deliverables; lack of awareness of schedule and status.
- Potential root cause: Schedules based on business ('top down') need rather than team-generated ('bottom up').
- Leading indicators: Earned value - schedule performance index (SPI).
- Mitigations: 'Bottom up' planning; monitor effort and schedule; engage earned value for monitoring, control as needed.
Risk: Unconstrained requirements growth
- Symptoms to watch for: Development staff cannot keep up with requirements changes.
- Potential root cause: Requirements change not well-managed.
- Leading indicators: Requirements change rate.
- Mitigations: Plan for change (employ a requirements/change control process); don't start development until there is a stable set of requirements.
Risk: Dysfunctional organization
- Symptoms to watch for: High project staff turnover; frequent staff reassignments; poor work environment; low productivity; staff lacks necessary skills and experience; and key role(s) are vacant.
- Potential root cause: Lack of motivating work environment; poor management of project prioritization; lack of experience with work needed on project.
- Leading indicators: Project staff turnover compared with historical trend; productivity; project team does not have an appropriate understanding of the requirements and project status.
- Mitigation: Monitor, manage, and control issues and risks; status reporting; external (peer) assessment of project plans.
Risk: Poor software quality
- Symptoms to watch for: High test defect counts; significant rework.
- Potential root cause: Focus on schedule rather than quality.
- Leading indicators: Test inspection yield; test defect density; defect discovery and closure rates/profiles.
- Mitigation: Create a development quality plan that focuses on inspection rather than (only) test; measure and track against quality plan; cultivate a focus on software quality.
Risk: Under-performance
- Symptoms to watch for: Low productivity.
- Potential root cause: Technical complexity; development environment changes; under-achievement.
- Leading indicators: Earned value - cost performance index (CPI).
- Mitigation: Engaged earned value, control as needed.
Manage risks and you'll greatly improve the probability of success.

How to Cite This Article
Graffius, Scott M. (2016, January 2). What Are Your Chances of Project Success? [From the Archives - First Published on 16 December 2012]. Available at: https://scottgraffius.com/blog/files/archive---software-development-risks-and-mitigations.html.

© Copyright 2016 Scott M. Graffius. All rights reserved. This material may not be published, broadcast, rewritten or redistributed without the express written permission of Scott M. Graffius.

Scott M. Graffius' Role in Advancing Project Management Institute (PMI) Standards Excellence


Introduction
The Project Management Institute (PMI) is a globally recognized authority in project management, publishing standards that guide professionals and organizations worldwide. As part of its rigorous development process, PMI engages subject matter experts to contribute to and review its publications, ensuring their accuracy, relevance, and applicability. Scott M. Graffius has had the privilege of contributing to several PMI standards. This article details his involvement.


Graffius was Involved in the Development of A Guide to the Project Management Body of Knowledge—Sixth Edition
- Publication Title: A Guide to the Project Management Body of Knowledge—Sixth Edition
- Credit: Graffius was an expert contributor and reviewer. His involvement was credited in the publication (see visual above).
- Description: A Guide to the Project Management Body of Knowledge (6th Edition) (PMBOK Guide) is a fundamental resource published by the Project Management Institute (PMI) in 2017, providing the essential knowledge base for managing projects across industries. This edition introduces the concept of Agile and other adaptive project management approaches alongside traditional methods, reflecting the evolving landscape of project management. It outlines 49 processes organized into ten knowledge areas and five process groups, serving as a guide for project managers to enhance project success rates through structured planning, execution, and monitoring. The PMBOK Guide is widely recognized as the standard for project management practices, supporting certifications like the Project Management Professional (PMP).
- Date of Publication: 2017
- If Available, Public Link to Preview of Entire Publication Including Credits Section: Link
The above information pertains to Graffius' involvement in A Guide to the Project Management Body of Knowledge—Sixth Edition. The PMI subsequently released the Seventh Edition. Here are links to it—the current edition—on Amazon:


Graffius was Involved in the Development of The Standard for Program Management—Fourth Edition
- Publication Title: The Standard for Program Management—Fourth Edition
- Credit: Graffius was an expert contributor and reviewer. His involvement was credited in the publication (see visual above).
- Description: The Standard for Program Management (4th Edition), published by the Project Management Institute (PMI) in 2017, is a definitive guide that outlines the principles and practices for managing multiple related projects under a program. This edition integrates the latest insights on program governance, stakeholder engagement, and benefits management, providing a framework for aligning projects with strategic business objectives. It's designed to help program managers navigate the complexities of coordinating, prioritizing, and optimizing resources across projects to achieve broader organizational goals.
- Date of Publication: 2017
- If Available, Public Link to Preview of Entire Publication Including Credits Section: Link, link
The above information pertains to Graffius' involvement in The Standard for Program Management—Fourth Edition. The PMI subsequently released the Fifth Edition. Here are links to it—the current edition—on Amazon:


Graffius was Involved in the Development of The Practice Standard for Project Estimating—Second Edition
- Publication Title: The Practice Standard for Project Estimating—Second Edition
- Credit: Graffius was an expert contributor and reviewer. His involvement was credited in the publication (see visual above).
- Description: The Practice Standard for Project Estimating (2nd Edition), issued by the Project Management Institute (PMI), serves as an authoritative guide for professionals engaged in project cost estimation. Released in 2019, this edition provides updated methodologies, tools, and techniques for developing accurate and reliable project estimates, covering everything from initial rough order of magnitude (ROM) estimates to definitive estimates. It emphasizes the importance of aligning estimates with project scope, schedule, and resource availability, offering guidance on how to manage risks and uncertainties inherent in estimating. This standard is invaluable for those looking to improve their project management practices, ensuring projects are planned with financial realism in mind.
- Date of Publication: 2019
- If Available, Public Link to Preview of Entire Publication Including Credits Section: N/A
The above information pertains to Graffius' involvement in The Practice Standard for Project Estimating—Second Edition. It remains the current edition. Here are links to it—still the current edition—on Amazon:


Graffius was Involved in the Development of the Practice Standard for Work Breakdown Structures—Second Edition
- Publication Title: The Practice Standard for Work Breakdown Structures—Second Edition
- Credit: Graffius was an expert contributor and reviewer. His involvement was credited in the publication (see visual above).
- Description: The Practice Standard for Work Breakdown Structures (2nd Edition) by the Project Management Institute (PMI) serves as an essential guide for project managers to effectively plan, organize, and manage project deliverables. Published in 2006, this edition explains the principles of creating a Work Breakdown Structure (WBS), a key project management tool used to break down project scope into manageable sections. It aligns with the PMBOK Guide, ensuring consistency with broader project management practices. The book outlines how to develop a WBS to clarify project goals, manage resources, and monitor progress, making it invaluable for both new and experienced project managers in various industries.
- Date of Publication: 2006
- If Available, Public Link to Preview of Entire Publication Including the Credits Section: Link

Conclusion
The above publications represent significant contributions to the field of project management. Graffius' involvement underscores his commitment to advancing the discipline with reliable, well-researched and validated guidance for field application. These resources continue to shape the industry and empower practitioners to achieve excellence in their projects.

Read on for:
- About the Project Management Institute,
- About Scott M. Graffius,
- How to cite this article,
- and more.

About the Project Management Institute
The Project Management Institute (PMI) is a leading global association for professionals in the field of project management. Founded in 1969, PMI is dedicated to advancing the profession through research, standards development, education, and certification. With members in nearly every country, PMI offers resources like the Project Management Professional (PMP) certification, which is recognized worldwide as a benchmark for project management expertise. The organization also promotes project management practices that drive better results, foster innovation, and enhance career opportunities for professionals across various industries. Through its extensive network and resources, PMI helps in connecting project managers, sharing knowledge, and advocating for the strategic value of project management.

About Scott M. Graffius

Scott M. Graffius sparks breakthroughs in AI, agile, and project management/PMO leadership as a globally recognized practitioner, researcher, thought leader, award-winning author, and international public speaker.
Graffius has generated more than USD $1.9 billion in business value for organizations served, including Fortune 500 companies. Businesses and industries range from technology (including R&D and AI) to entertainment, financial services, and healthcare, government, social media, and more.
Graffius leads the professional services firm Exceptional PPM and PMO Solutions, along with its subsidiary Exceptional Agility. These consultancies offer strategic and tactical advisory, training, embedded talent, and consulting services to public, private, and government sectors. They help organizations enhance their capabilities and results in agile, project management, program management, portfolio management, and PMO leadership, supporting innovation and driving competitive advantage. The consultancies confidently back services with a Delighted Client Guarantee™. Graffius is a former vice president of project management with a publicly traded provider of diverse consumer products and services over the Internet. Before that, he ran and supervised the delivery of projects and programs in public and private organizations with businesses ranging from e-commerce to advanced technology products and services, retail, manufacturing, entertainment, and more. He has experience with consumer, business, reseller, government, and international markets.
He is the author of two award-winning books.
- His first book, Agile Scrum: Your Quick Start Guide with Step-by-Step Instructions (ISBN-13: 9781533370242), received 17 awards.
- His second book is Agile Transformation: A Brief Story of How an Entertainment Company Developed New Capabilities and Unlocked Business Agility to Thrive in an Era of Rapid Change (ISBN-13: 9781072447962). BookAuthority named it one of the best Scrum books of all time.
Prominent businesses, professional associations, government agencies, and universities have featured Graffius and his work including content from his books, talks, workshops, and more. Select examples include:
- Adobe,
- American Management Association,
- Amsterdam Public Health Research Institute,
- Bayer,
- BMC Software,
- Boston University,
- Broadcom,
- Cisco,
- Coburg University of Applied Sciences and Arts Germany,
- Computer Weekly,
- Constructor University Germany,
- Data Governance Success,
- Deimos Aerospace,
- DevOps Institute,
- EU's European Commission,
- Ford Motor Company,
- Gartner
- GoDaddy,
- Harvard Medical School,
- Hasso Plattner Institute Germany,
- IEEE,
- Innovation Project Management,
- Johns Hopkins University,
- Journal of Neurosurgery,
- Lam Research (Semiconductors),
- Leadership Worthy,
- Life Sciences Trainers and Educators Network,
- London South Bank University,
- Microsoft,
- NASSCOM,
- National Academy of Sciences,
- New Zealand Government,
- Oracle,
- Pinterest Inc.,
- Project Management Institute,
- SANS Institute,
- SBG Neumark Germany,
- Singapore Institute of Technology,
- Torrens University Australia,
- TBS Switzerland,
- Tufts University,
- UC San Diego,
- UK Sports Institute,
- University of Galway Ireland,
- US Department of Energy,
- US National Park Service,
- US Tennis Association,
- Veleučilište u Rijeci Croatia,
- Verizon,
- Virginia Tech,
- Warsaw University of Technology,
- Wrike,
- Yale University,
- and many others.
Graffius has been actively involved with the Project Management Institute (PMI) in the development of professional standards. He was a member of the team which produced the Practice Standard for Work Breakdown Structures—Second Edition. Graffius was a contributor and reviewer of A Guide to the Project Management Body of Knowledge—Sixth Edition, The Standard for Program Management—Fourth Edition, and The Practice Standard for Project Estimating—Second Edition. He was also a subject matter expert reviewer of content for the PMI’s Congress. Beyond the PMI, Graffius also served as a member of the review team for two of the Scrum Alliance’s Global Scrum Gatherings.
Graffius has a bachelor’s degree in psychology with a focus in Human Factors. He holds eight professional certifications:
- Certified SAFe 6 Agilist (SA),
- Certified Scrum Professional - ScrumMaster (CSP-SM),
- Certified Scrum Professional - Product Owner (CSP-PO),
- Certified ScrumMaster (CSM),
- Certified Scrum Product Owner (CSPO),
- Project Management Professional (PMP),
- Lean Six Sigma Green Belt (LSSGB), and
- IT Service Management Foundation (ITIL).
He is an active member of the Scrum Alliance, the Project Management Institute (PMI), and the Institute of Electrical and Electronics Engineers (IEEE).
He divides his time between Los Angeles and Paris, France.
Thought Leader | Public Speaker | Agile Scrum Book | Agile Transformation Book | Blog | Photo | X | LinkedIn | Email




Sign up for Miro—it's free!
(Want more features? You can always upgrade to a paid plan.)


How to Cite This Article
Graffius, Scott M. (2025, February 12). Scott M. Graffius' Role in Advancing Project Management Institute (PMI) Standards Excellence. Available at: https://scottgraffius.com/blog/files/scott-m-graffius-role-in-advancing-project-management-institute-(pmi)-standards.html. 

Content Acknowledgements
This article uses limited excerpts from Project Management Institute (PMI) publications (Practice Standard for Work Breakdown Structures—Second Edition, A Guide to the Project Management Body of Knowledge—Sixth Edition, The Standard for Program Management—Fourth Edition, and The Practice Standard for Project Estimating—Second Edition), attributed to the PMI and used under fair use for news reporting and analysis. PMI name, mark, and content are the property of PMI. 

Copyright
Copyright © Scott M. Graffius. All rights reserved.
Content on this site—including text, images, videos, and data—may not be used for training or input into any artificial intelligence, machine learning, or automatized learning systems, or published, broadcast, rewritten, or redistributed without the express written permission of Scott M. Graffius.
