Resolving tension
Using Bruce Tuckman's Phases of Team Development
29 January 2018
A NEWER VERSION OF THIS ARTICLE IS AVAILABLE HERE: https://scottgraffius.com/blog/files/graffius-phases-of-team-development-2026.html
Teams go through stages of development, and Bruce Tuckman established a popular framework on the subject. According to Tuckman, all phases—Forming, Storming, Norming, Performing, and Adjourning—are necessary for the team to grow, tackle problems, find solutions, plan work, and deliver results. This article provides a brief overview of the model, including descriptions and strategies for each phase.

1. Forming
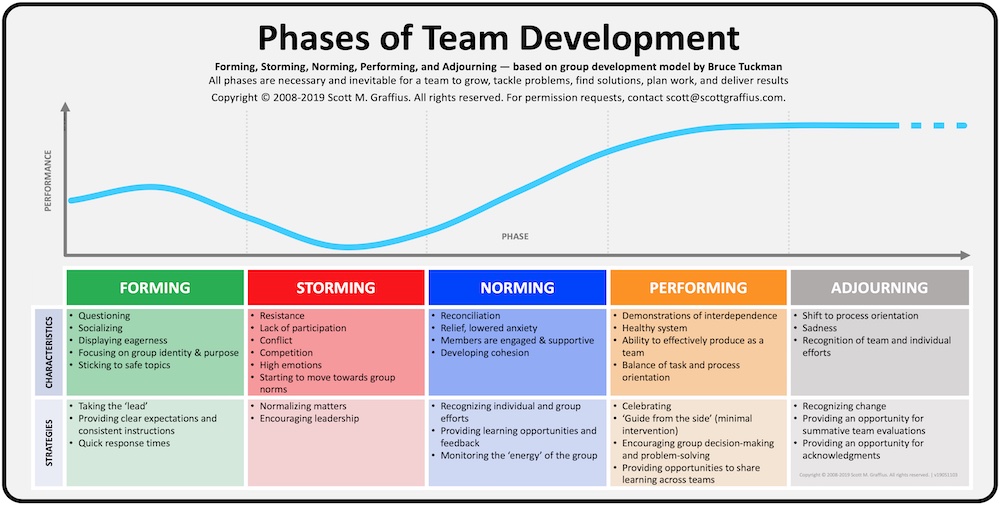
Characteristics of Forming include questioning, socializing, displaying eagerness, focusing on group identity and purpose, and sticking to safe topics. Strategies for this phase include taking the 'lead,' providing clear expectations and consistent instructions, and quick response times.
2. Storming
Traits of Storming include resistance, lack of participation, conflict, competition, high emotions, and moving towards group norms. Strategies for this stage include normalizing matters and encouraging leadership.
3. Norming
Features of Norming include reconciliation, relief, lowered anxiety, members are engaged and supportive, and developing cohesion. Strategies for this phase include recognizing individual and group efforts, providing learning opportunities and feedback, and monitoring the 'energy' of the group.
4. Performing
Characteristics of Performing include demonstrations of interdependence, healthy system, ability to effectively produce as a team, and balance of task and process orientation. Strategies for this stage include celebrating, 'guide from the side' (minimal intervention), encouraging group decision-making and problem-solving, and providing opportunities to share learning across teams.
5. Adjourning
Traits of Adjourning include a shift to process orientation, sadness, and recognition of team and individual efforts. Strategies for this phase include recognizing change, providing an opportunity for summative team evaluations, and providing an opportunity for acknowledgments.

The illustration summarizes the above information—and it shows how performance fluctuates as teams move through each phase. This information may be helpful for looking at your team.

Permission Request Information
To request permission to use the 'Phases of Team Development' visual, contact Scott M. Graffius. If approved, high resolution JPG and PNG image files will be provided, subject to terms and conditions.

Copyright © Scott M. Graffius. All rights reserved. This material may not be published, broadcast, rewritten or redistributed without the express written permission of Scott M. Graffius.
